Geophysical Remote Sensing at 3YE25
Jami J. Lockhart
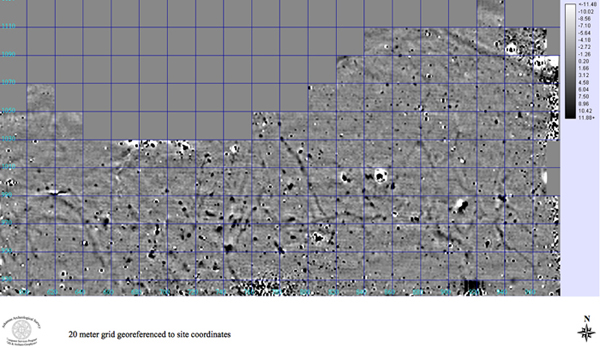
As described on another portion of our web site (3YE25 Survey), the original plan for the Carden Bottoms project included broad-scale coverage of the study area using gradiometry to initially assess the location and density of archaeological features. Gradiometry was selected for the efficiency with which a comparatively large area can be surveyed in a relatively short period of time. Physical properties that can be detected using gradiometry include thermoremanent magnetism brought about by burning or firing, induced magnetism detected as anthropogenic changes to or enrichment of natural soils, and soil disturbances such as digging and heaping that displace and redistribute naturally more-magnetic topsoil. As also described previously (3YE25 Tree Planting), the resulting composited gradiometry results for approximately 7.5 hectares (Figure 1) were used to assign low-impact locations for 300 trees to be planted by the Natural Resource Conservation Service creating a long-term conservation area at Carden Bottoms. The site-wide gradiometry was also used for planning the sequence and location of higher-resolution multisensor remote sensing surveys that had been planned to further analyze and define geophysical anomalies. The use of multisensor geophysics at the site has enabled the pin-pointed excavation of specific feature types and analysis of intrasite settlement pattern and community organization.
|
|
Figure 1. Broad-scale gradiometry.
|
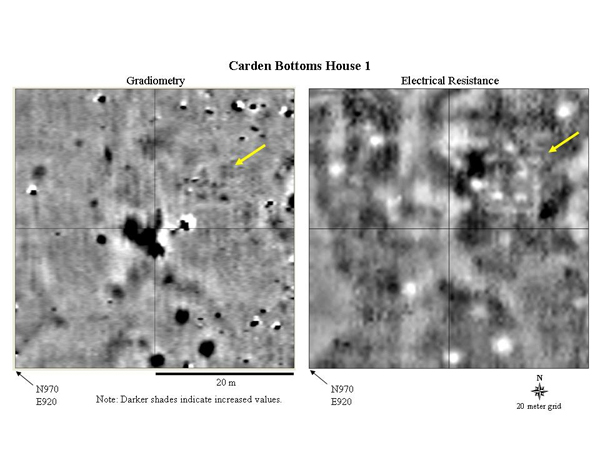
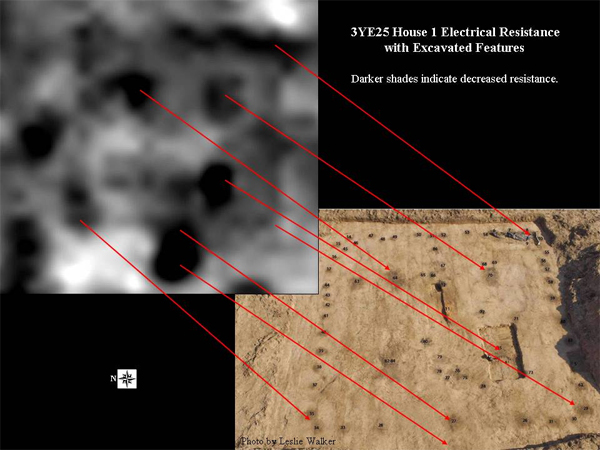
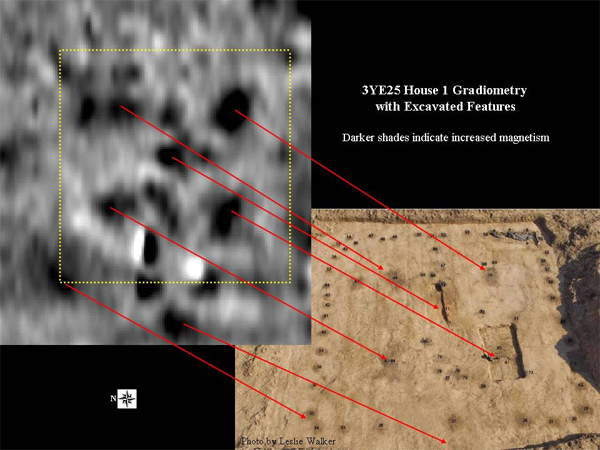
Early in the process of multisensor survey, electrical resistance imagery indicated a 7.5 meter square anomaly interpreted as a prehistoric structure (Figure 2). Also, visible within the square anomaly were four discrete, regularly-spaced areas of decreased electrical resistance interpreted as interior support posts, along with a possible west-facing entrance. Gradiometry for the area (Figure 2) provided corroborating evidence in the form of increased magnetic anomalies corresponding to the interior support posts and a central hearth. Other features are visible in Figure 2, most notably the large confirmed pit feature located in the center of the gradiometry. Figures 3 and 4 show the correspondence between geophysical anomalies and the fully excavated House 1 at Carden Bottoms. Although excavations clearly defined the wall posts, support posts, hearth, and other interior features, it was noted that the living floor of the structure had been largely plowed away by many years of modern cultivation.
|
|
Figure 2. House 1 geophysics.
|
|
|
Figure 3. House 1 electrical resistance and excavated features.
|
|
|
Figure 4. House 1 gradiometry and excavated features.
|
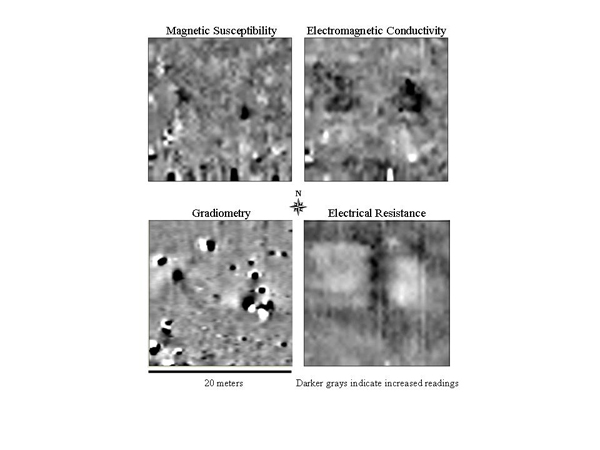
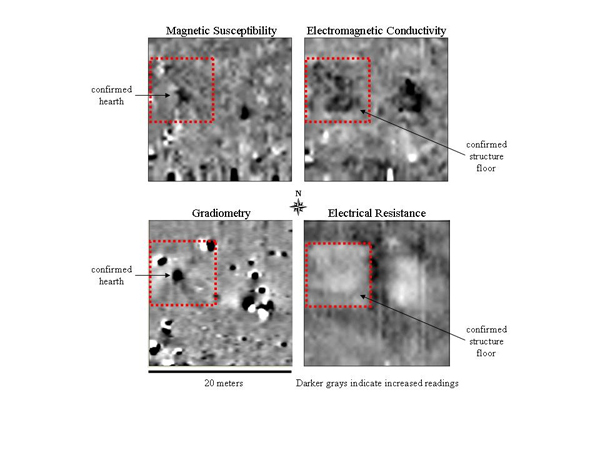
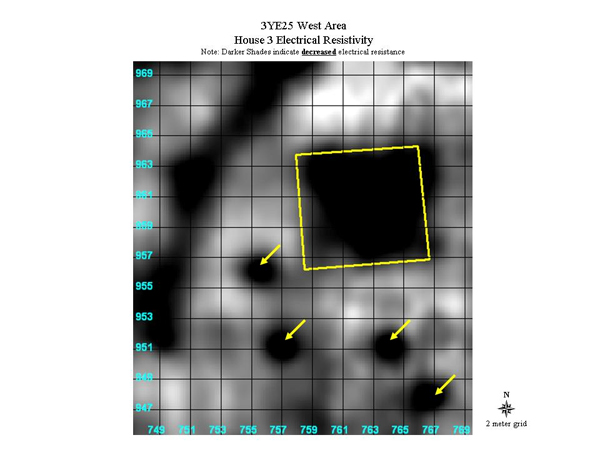
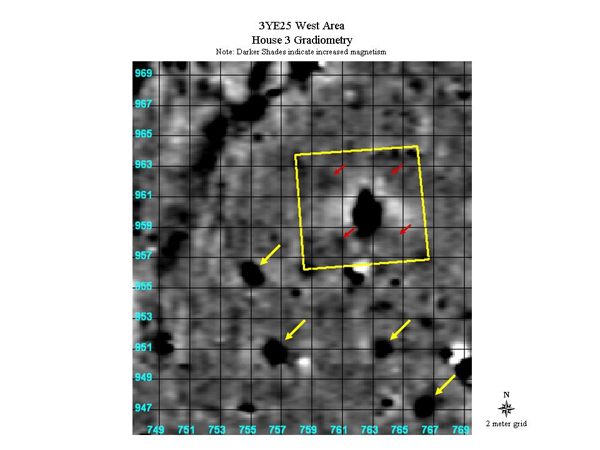
Initially, data sets for gradiometry, electrical resistance, electromagnetic conductivity, magnetic susceptibility, and ground penetrating radar were acquired for specific locations. Figure 5 shows four data sets for a single 20 x 20-m geophysical grid. Electrical resistance clearly delineates the largely undisturbed floor of a structure designated and confirmed as House 3. Comparing the resistance signatures of Houses 1 and 3, illustrates the geophysical differences between an intact floor and a floor that has been removed by plowing. While House 3 shows consistently reduced resistance across the entire floor, House 1 exhibits reduced resistance only in the areas of the interior posts and walls. The consistently low resistance of the intact floor of House 3 is attributed to the differential moisture retention on the buried floor. Evidence indicates that House 3 was intentionally burned and covered, thereby capping the floor, and more effectively holding moisture above/on the floor as compared to the surrounding undisturbed soil. The electromagnetic conductivity data indicate enhanced electrical conductance in the area of the floor as moist soils generally conduct electricity more efficiently than drier soils. Exterior pits at the site also appear as less resistant and more conductive. Whereas resistance and conductivity are good indicators of house floors at Carden Bottoms, magnetic susceptibility and gradiometry, in particular, accentuate hearths and architectural features such as burned posts and pits (Figure 6).
|
|
Figure 5. Multisensor geophysics for House 2.
|
|
|
Figure 6. Multisensor geophysics with House 2 outline.
|
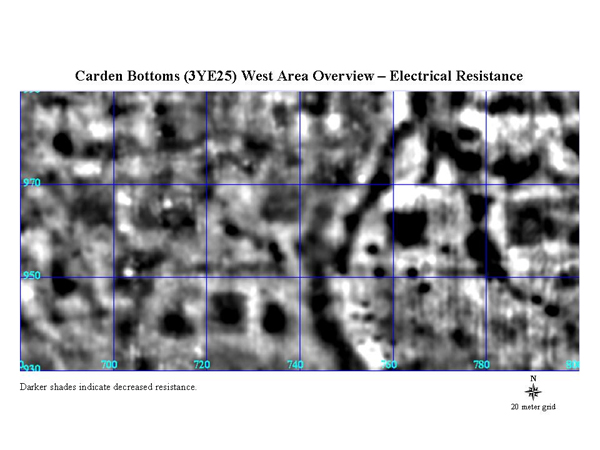
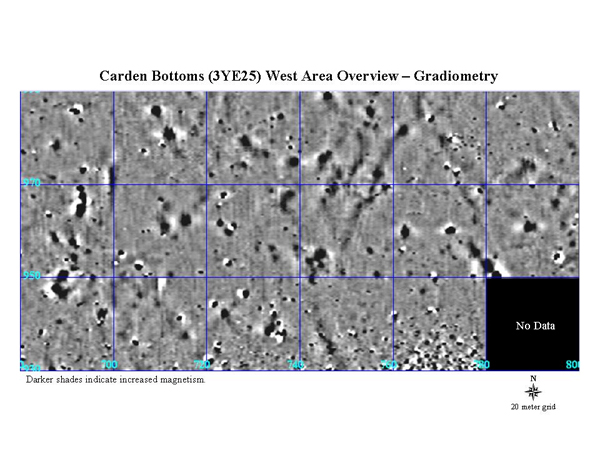
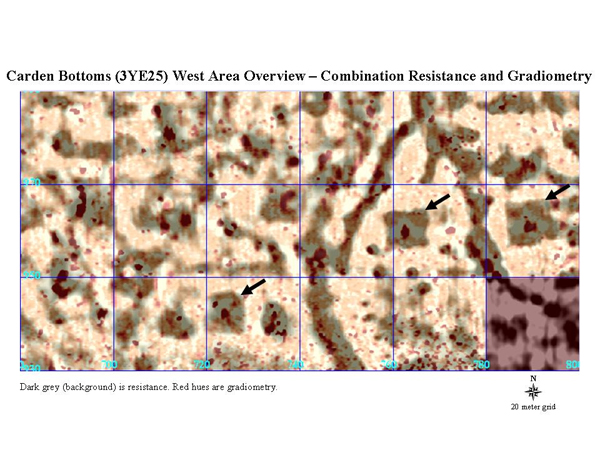
Figures 7 – 9 illustrate a visualization tool that has proven useful in the project. After electrical resistance (Figure 7) and gradiometry data (Figure 8) have been georeferenced using GIS, the resistance data layer can be rendered translucent and overlaid onto the gradiometry providing a simultaneous view of both data sets (Figure 9) in which central hearths and other interior features can be seen “through” the square signature of the buried structures prior to excavation.
|
|
Figure 7. West Area electrical resistance.
|
|
|
Figure 8. West Area gradiometry.
|
|
|
Figure 9. West Area electrical resistance and gradiometry combined.
|
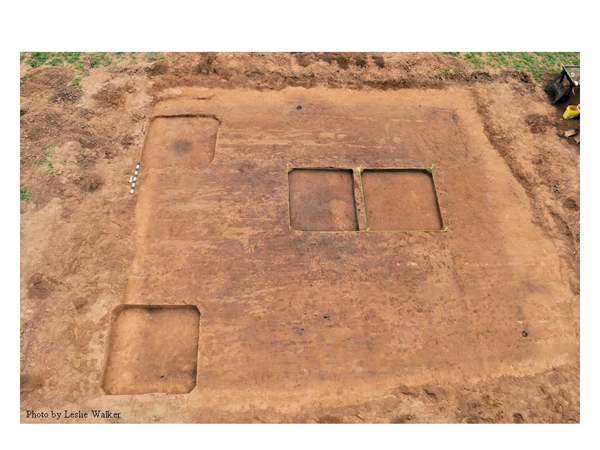
GIS also enables locationally-precise excavation of specific archeological features. Figures 10 and 11 show electrical resistance and gradiometry for House 2 along with a 2 x 2-m excavation grid superimposed on the imagery. Figure 12 shows the excavated, square outline of House 2.
|
|
Figure 10. House 3 electrical resistance and excavation grid.
|
|
|
Figure 11. House 3 gradiometry and excavation grid.
|
|
|
Figure 12. Photo of House 3 just above floor.
|
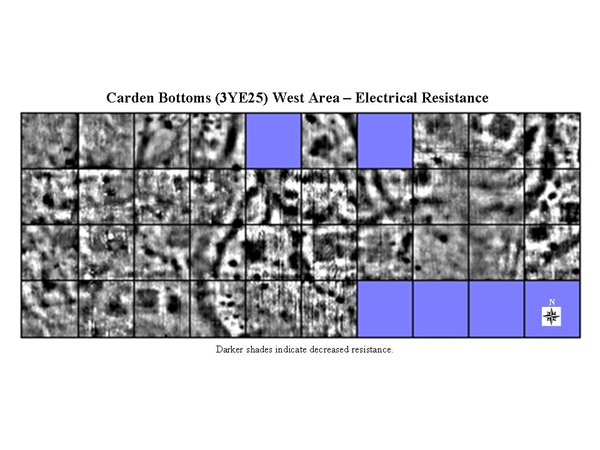
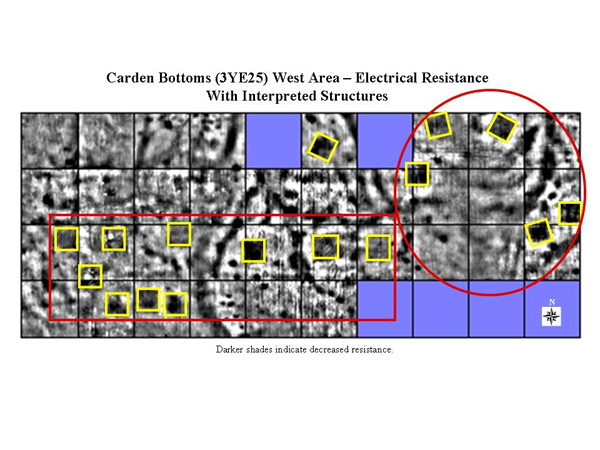
To date, more than 7 hectares of the Carden Bottoms site have been covered with gradiometry, and 1.6 hectares have been covered with electrical resistance (Figure 13) and gradiometry with increased resolution. In addition to providing guidance for excavations, geophysical remote sensing is also indicating possible intrasite structure and settlement patterning. Although hypothetical at this early stage in the research, we are beginning to see the possible emergence of different domestic patterns as illustrated in Figure 14 by rows of cardinally-oriented structures contrasted with a group of structures possibly oriented inward toward a less-intensively occupied court. Further exploration of these seemingly different “neighborhoods” of structures is planned in the form of site-wide remote sensing and strategically-targeted excavations.
|
|
Figure 13. West Area electrical resistance to date.
|
|
|
Figure 14. West Area electrical resistance with possible intrasite settlement patterns.
|
|

