Cooperative Research by the National Park Service, Midwest Archaeological Center, Pea Ridge National Military Park, and the Arkansas Archeological Survey
December 12, 2015
We are currently working on the first year of a prospective four-year project to conduct an archeological inventory within Pea Ridge National Military Park. The areas to be studied are associated with the March 1862 Civil War battle at Pea Ridge, Arkansas (also known as the Battle of Elkhorn Tavern), which was one of the most significant actions of the War in this region. The project is a collaboration between the Arkansas Archeological Survey and the Midwest Archeological Center of the National Park Service, organized under the federal Cooperative Ecosystem Studies Units (CESU) program. In addition to enriching our understanding of site history, the project will provide valuable training opportunities for students and volunteers.
The primary goal of the investigation is to acquire new information about the extent and consequences of the battle so that the National Park can provide more accurate and comprehensive interpretation on site and at the Visitor Center.

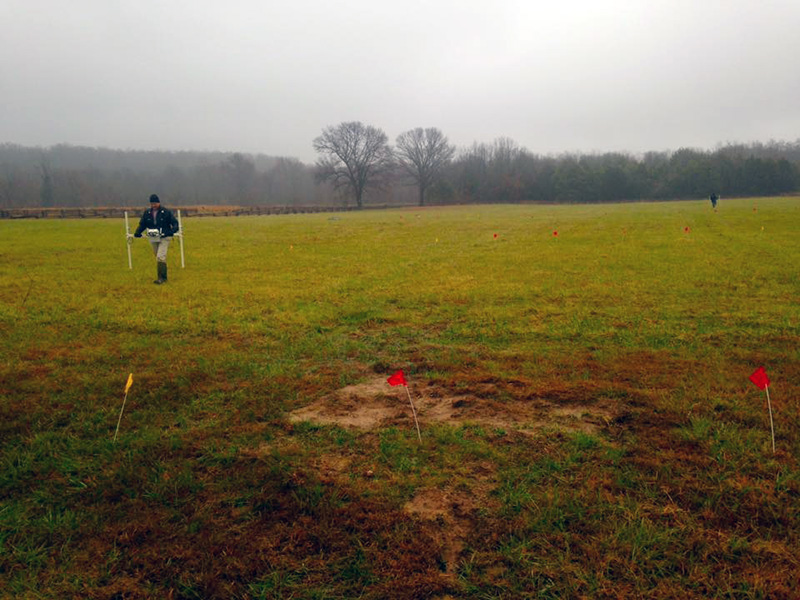
While the site has been subject to a series of very productive investigations spanning the past half-century, we will be applying a series of broad-area geophysical prospecting techniques capable of detecting evidence beyond the reach of earlier methods. In addition to standard metal detection, we are also using high-resolution magnetometry, accompanied by fine scale mapping with high-accuracy GPS and laser total station instruments. Magnetometry measures small changes in the earth’s magnetic field and can identify, in addition to metallic artifacts, locations where sediments have been removed and replaced (for example, where a pit or trench has been dug and filled back in with different sediments), or where buried sediments have been subjected to high heat.
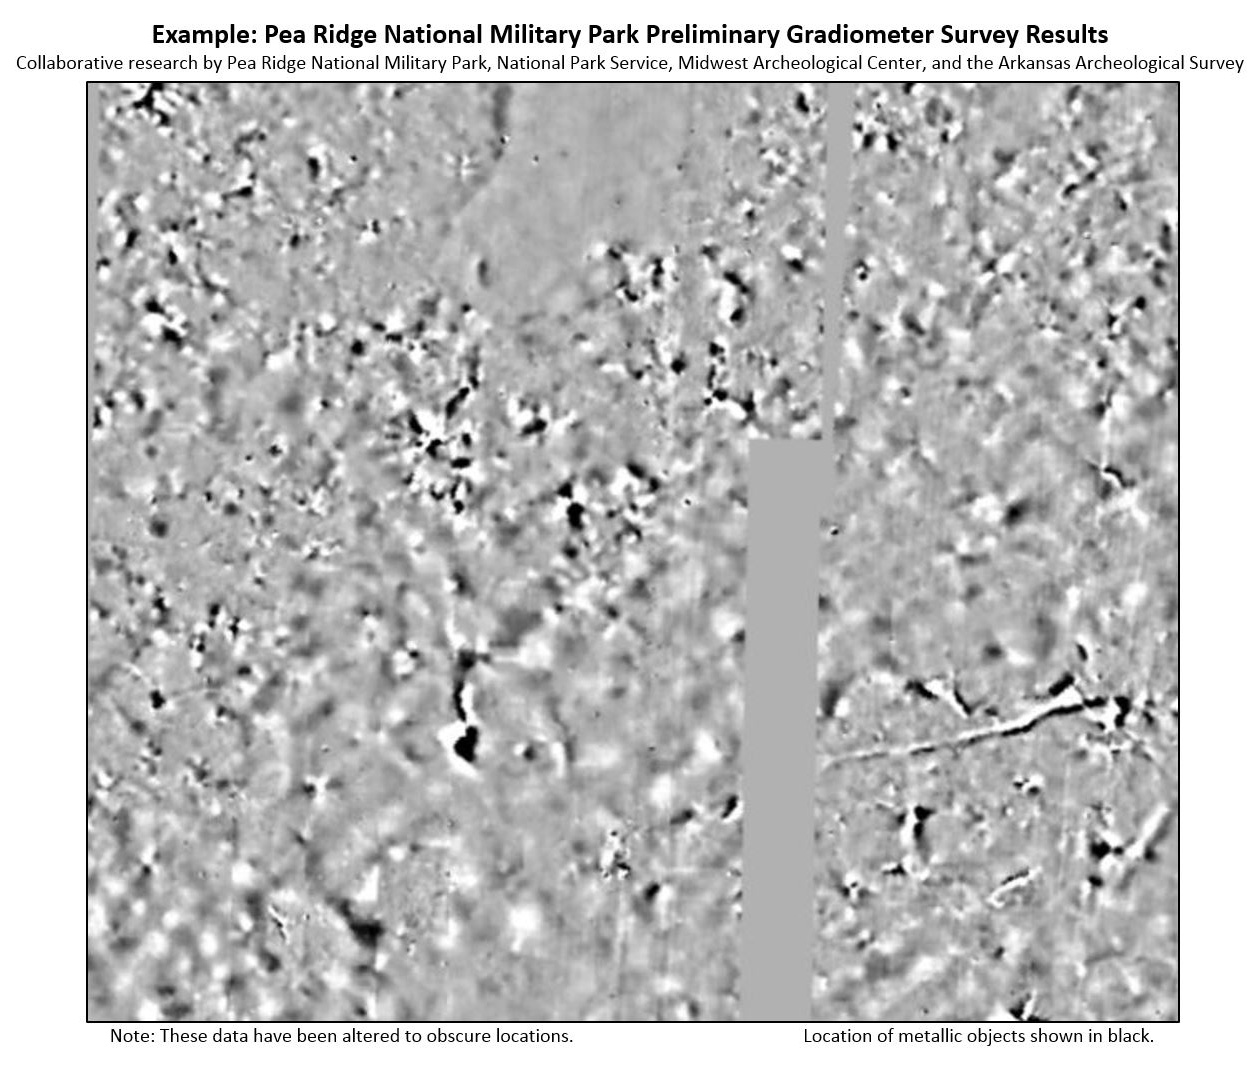
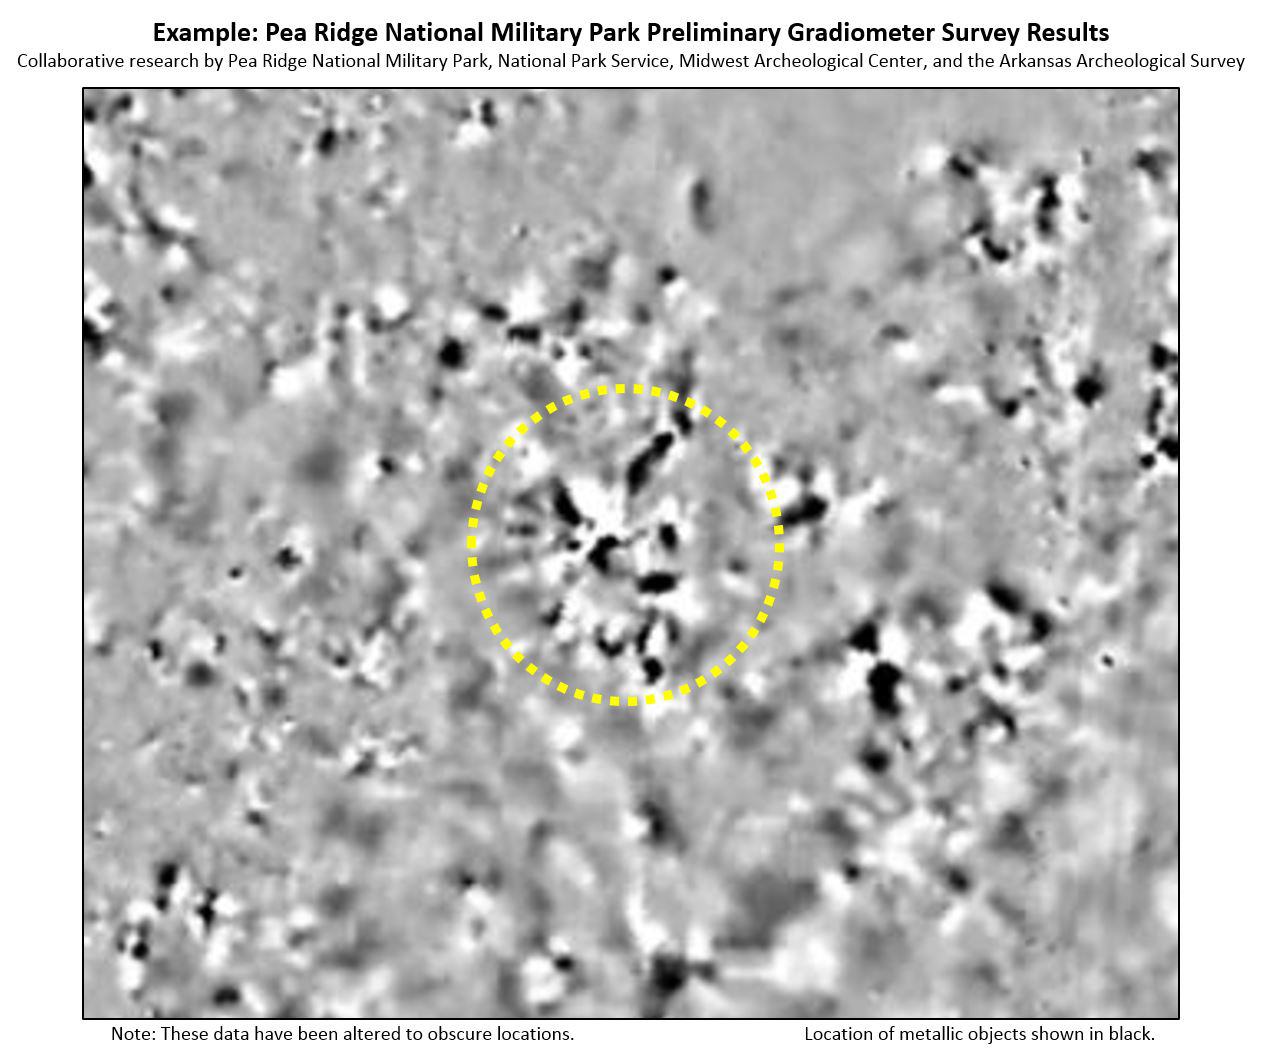
Our initial magnetometer survey covers 27 acres of Ruddick’s Field, where much of the fighting took place on the first afternoon of the battle. The magnetometry has produced more than 1.6 million individual measurements to date. The data points are then run through a series of mapping and image processing applications to produce the final set of graphics (like the one seen above) that identify the locations of artifacts and shapes of features.

These maps show the data enhanced to illustrate the distribution and extent of the magnetic anomalies. There are numerous trends reflected in the data, and we will eventually examine each one in an exhaustive treatment to understand what they mean. From initial indications, it is interesting to note the broad trends of increased metal in portions of the study area. Much more post-processing and interpretation will be accomplished in the weeks and months leading up to test excavations.
The results of our survey will be analyzed using modern geographical information system (GIS) computer applications to provide a sampling framework for follow-up test excavations. Over the long course of the project, we will cover a number of carefully selected areas. The results of this initial study will serve as a model for the investigations during the following three years.
Acknowledgements:
Kevin Eads (PERI Superintendent)
Steve De Vore (NPS MWAC)
Nolan Moore (PERI)
Team Members:
Dr. Jami J. Lockhart (co-PI)
Dr. Jamie C. Brandon (co-PI)
Dr. George Sabo, III (co-PI)
Dr. Carl Carlson-Drexler
Mike Evans
Jared Pebworth
John Samuelsen
Adam Weiwel
Lydia Rees
Jerry Hilliard
Deborah Weddle
Dr. Carol Colaninno-Meeks

